Wiemer Salverda
University of Amsterdam, the Netherlands; w.salverda2@contact.uva.nl
Joop Hartog
University of Amsterdam, the Netherlands, and IZA, Germany; jhartog@contact.uva.nl; Groeneweg 10 4223 MD Hoornaar The Netherlands (corresponding author)
JEL codes: J21,J31,J61
KEYWORDS: wages, institutions, dual earners, Netherlands
The Netherlands has long been an example of a highly and centrally institutionalized labor market paying considerable attention to equity concerns. We describe how this model has been falling apart under the influence of the neoliberal ideology. Fracturing of the labor force by the rapid demise of the single-earner model and accelerating immigration, falling union density, and reductions in welfare state provisions have shrunk labor’s market power centrally and decentrally. Wages lagged far behind productivity growth, job security strongly declined and wage inequality increased. This comes to the fore with a lack of offensive union power when after 2016 labor demand accelerates and the economy and employment quickly reach new heights after the pandemic crisis.
A shorter, less detailed version of this paper appeared in World of Labor.
Social dialogue has been a hall-mark of the institutional framework in the Netherlands since 1945 (Teulings and Hartog, 1998. Salverda, 2018). This dialogue involves three parties: employer associations, union federations, and the government. It stretches beyond affairs directly concerning employers and employees, extending to such matters as social and labor market legislation, the pension system, and a broad range of economic policy issues, with much explicit attention given to economic equity.
The institutional structure of the labor market in the Netherlands has remained largely unchanged formally but labor market developments weakening its trade union partners and social policy measures have drastically changed its operation and its embedding in welfare state provisions.[i] Increased competitive pressures and stronger volatility in output markets have motivated employers to shift a growing proportion of financial risk onto workers. With weakened labor unions and governments rolling back social policies, employers have been able to keep wages down and to hire from a more varied and therefore fractured labor force. New contract arrangements have provided workers with more opportunities to engage in flexible and part-time work, but have also raised job and career insecurity. The effects have become clearly visible during the accelerated growth of employment and the economy since 2016. Ultimately, social dialogue is a strong as the weakest party.
Figure 1 presents a graphical overview of some key characteristics of Dutch economic development.[ii] We note several positive developments. The employment-to-population ratio (15-74) on balance did not move to 2016 but then it shot up from 67.0% to 73.2% with a tiny pause in 2020. The country’s economy seems to have found an adequate answer to the double whammy of covid and Ukraine. The labor market is highly flexible, being characterized by very large shares of part-time work and flexible labor contracts, but after 2016 the part-time share stalls, as full-time work grows too, and flexible numbers halt and permanent contracts grow. After 2016 the labor force becomes much more dependent on people with an immigrant background, be they immigrated personally or born from immigrated parents; employment rates of the latter category now closely resemble other Netherlands-born and differ significantly from new immigrants. The unemployment rate started at 4.5%, rose to 8.3% in 2014 but ends at 3.7% in 2024 and has hovered below the vacancy rate since 2022. But there is also a darker side. Wages have strongly lagged productivity growth and the wage share in national income has fallen to its lowest level in 2022 to 2024. After a modest increase to 2016 wage inequality falls implying general wage moderation, hall-mark of the Dutch economy. The record-high trade surplus (12% of GDP) that was attained in 2024 signals international imbalances and may rest a good deal on lagging wages. Protection of vulnerable workers has deteriorated as employers shifted an increasing amount of risk onto employees. Flex contracts, so-called bogus self-employment, treatment of immigrant workers and the level of the minimum wage have all become the subject of much political debate in the country. A very strong influx of new immigrant workers since 2016 gives them a larger share in the labor force than those born from immigrant parents, and aggravates their poor integration and maltreatment in the labor market as well as overall housing problems. The labor force has aged considerably, leading to long debates, followed by substantial adjustments in the pension system and the retirement age.

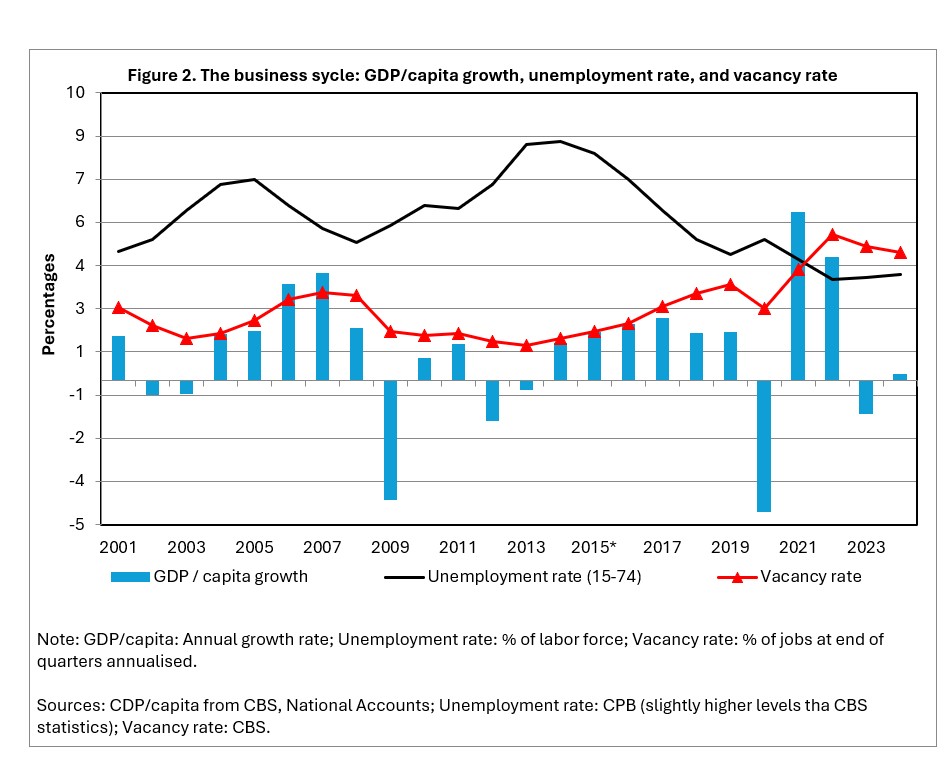
As Figure 2 shows, economic activity declined slightly in 2002 and 2003, fiercely in 2009, less in 2012 and 2013. Particularly telling though is 2020, the first year of the pandemic. The Dutch economy is strongly export-oriented, with exports growing from 66% of GDP in 2001 to 82% in 2024, a large and growing share of which is transit trade (currently 36%, from 32% in 2001). The trade balance surplus grew from 7% of GDP to 11% in 2016. Then it fell back to less than 9% in 2022 as exploding energy prices affected imports more than exports. However, the surplus turned very quickly to 12% in 2024, the highest level ever reached (keep in mind that the balance of transit trade is almost nil). It is very large indeed in international comparison, and demonstrates that, in this respect, the country has got its act together very quickly after Covid and the Russian invasion. After the unemployment peak of 2013-2015, the economy developed towards the lowest unemployment rates and the highest vacancy rates of the period. This has evoked comments, e.g. from the Netherlands Central Bank, that the country’s wage level may be too low.
The Dutch labor market now stands out internationally, with extremely high frequencies of part-time work, flexible contracts, own-account self-employed and a dominant household type consisting of 1.5 labor participants: typically, a well-paid full-time working husband and a part-time wife but next to a still large share of single-earner households. This shows one way of dealing with increased globalization and international competition as well as with the competing pressures of work and family life. Below, we will present and discuss these developments for employment levels and structure (section 2), employment heterogeneity by personal characteristics (section 3) and wages (section 4). We discuss and interpret the findings in section 5, and conclude with a summary and policy advice in section 6.
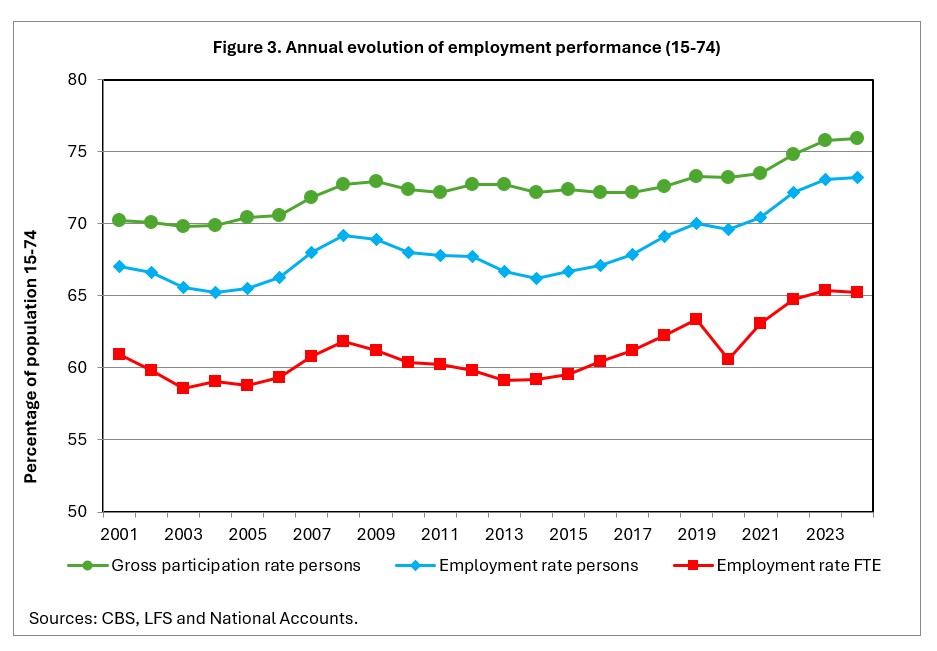
The population of the Netherlands has grown strongly (by immigration) and employment rates have increased substantially. The population grew from 16 million in 2001 via 17 million in 2016 to almost 18 million in 2024, at an annual growth rate that accelerated from 0.43% up to 2016 to 0.79% thereafter. The working-age population (15−74 years) grew similarly by 0.47% and 0.68% respectively and the labor force by 0.68% and 1.45% respectively. Overall, the employment head-count increased at a faster rate, going from 8.4 to 9.8 million, but more slowly until 2016 (0.48%) and four times faster since then (1.96%). These developments have lifted the gross participation rate from 70.2% to 75.9%, and the employment rate from 67.0% to 73.2% (Figure 3). All this regards a head count of persons aged 15 to 74, but note that ages 15 to 64 score a significantly higher employment rate of 82.3%, which is often shown in international comparisons (e.g. Eurostat). The employment volume, which is measured by the count of total hours worked, grew less at first (0.38%) but more than five times faster after that (1.97%). Hence, average annual hours worked per worker vary only moderately from 1451 (2001) to 1422 (2012) and 1457 (2019) to 1434 hours in 2024 (disregarding the year 2020). Hours worked per capita 15-74 first fell from 839 (2001) to 780 (2014) but subsequently rose at an annual growth of 1.26% to 873, which is well above the initial level. Notably, head-count employment hardly fell in the pandemic year of 2020 but hours worked did while, remarkably, hours actually paid hardly changed. We come back to this divergence below when discussing wages.
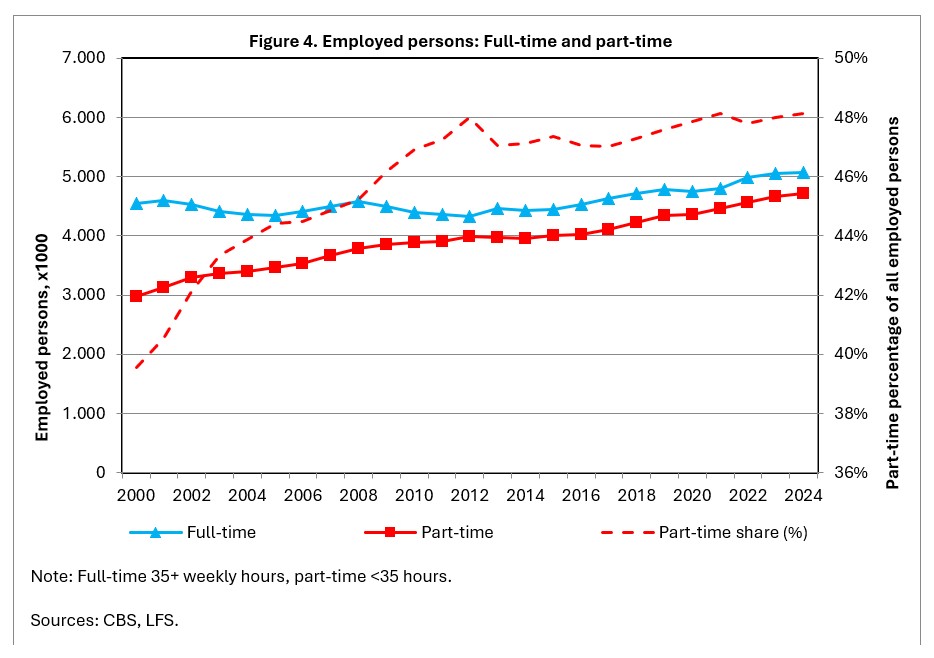
Relatively low average hours per worker are a consequence of the strong growth in part-time work (Figure 4, defined as fewer than 35 usual weekly hours). Among employed persons, almost half of them work part-time, a share that was reached after a steep increase from 2000 to 2012 (among jobs over the year the part-time share attains a majority of 56%). The number of part-time workers grew on average by 1.82% to 2016. It grew clearly faster after 2016 by 2.27% but then the number of full-time workers showed also a remarkable rise (+1.62%) while it had remained almost unchanged to 2016. Until 2016 100% of employment growth was in part-time employment, versus 55% thereafter. As a result, the part-time share rose from 40% to 48% in 2016 but has stagnated since. The Dutch rate of part-time employment is extremely high in international comparison: 43%, far above Germany and Austria that follow next at 30% to 31% (following Eurostat’s self-reported status (lfsa_esegp)).
This may be explained from a combination four factors: the individual taxation of incomes from labor instead of at the household level which was introduced in the early 1970s, the traditionally low levels of the Dutch female employment rate until then, the preferences of workers for combining paid work with household care or with participation of education, and last but not least the pressure of employers to optimize labor efforts by cutting slack hours. At the same time, very few part-timers in the Netherlands work so involuntarily (2.2% or 8 times less than EU average – Eurostat (lfsa_eppgai] 2024). However, the international difference is much smaller (3 times) for the share of involuntary parttime among total employment (1.0%) because of the almost fifty-fifty division between full-time and part-time. Evidently, the involuntary share is still less per capita of the working-age population (0.7%) because of the comparatively high employment rate. Interestingly, the latter share rises fourfold from 2001 while full-time employment stagnates and exceeds the EU27 average in 2014 (4.0% to 3.8%). After 2014 it decreases equally strongly, likely because worker preferences for hours of work align better with employment options due the new growth of full-time employment and the faster increase of part-time jobs with the most hours (which is mirrored by the declining share of part-timers desiring longer hours (19% to 11%).
Considered separately, average annual part-time hours grew significantly and pretty steadily from 853 (2010) to 973 (2024) and so did full-time hours, from 1759 to 1791. Therefore, the evolution of overall average hours is basically a matter of employment composition and not of individual efforts, i.e., that people would be unwilling to work longer hours as is often stated in the Dutch public debate. Part-time jobs cover a broad range of weekly hours, starting with small jobs of less than 12 weekly hours. Up to 2016 their share among all employed hovered between 11% and 12%, but then dropped significantly to 9%. Among youth aged 15−24, the share grew strongly from 26% in 2003 to 44% but then also fell to 36% in 2024. Almost all these youngsters simultaneously follow an education. In 2003, 68% of employed youth were also in school; by 2016, this percentage had risen to 76% (after a +6 percentage points the LFS series break), and it amounted to 74% in 2024. These young employees are integral to the workings of the Dutch labor market, as they make up some 17% of total employment and not just as a matter of summer jobs but with little variation over the quarters of the year. Though they work shorter hours they still contribute 11% of total hours worked. Adult part-timers have shifted to longer hours apparently, and mitigated also the decline of average hours.
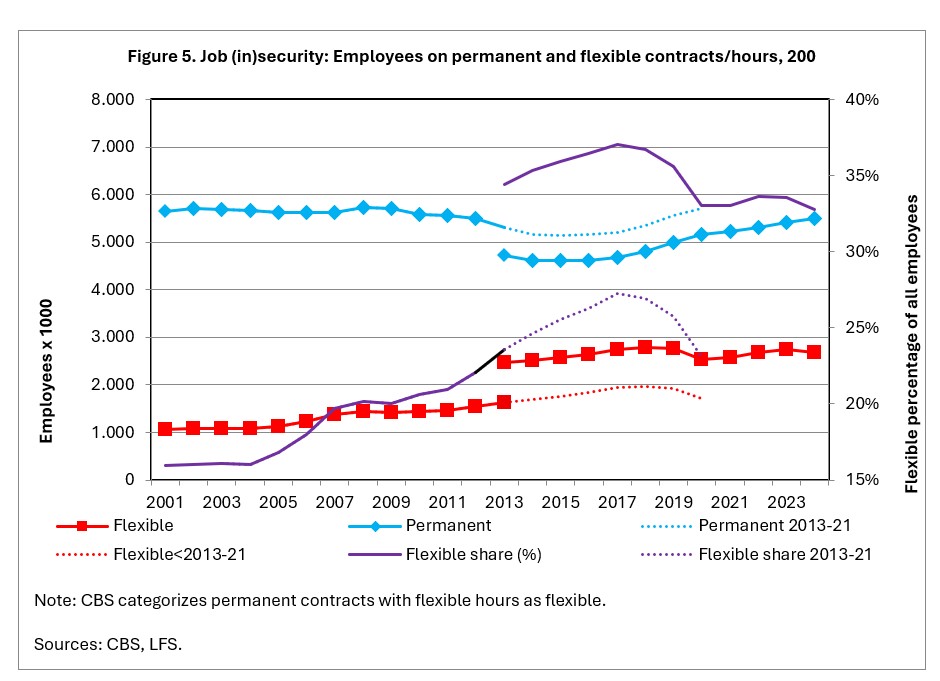
About a third of the employees now have a flexible job (e.g., temporary contracts, flexible hours, probation periods, temp agency work). A large share of the reported increase relates to a change of definition in 2013, as the national LFS became better aligned with Eurostat’s. Up to 2013 it was steadily increasing; under the new definition a continued increase turned into decrease after 2017.
Figure 5 gives the details: rapid growth from around 16% in 2001−2004 to 26% in 2016 (according to the initial definition of Statistics Netherlands (CBS), but 36% in retrospective following the LFS revision of 2021, followed by a decrease to 33% in 2024. The LFS revision is particularly important for flexible work. Dutch flexibility attains by far the highest percentage among EU countries: 26%, with Portugal and Spain next at 16% (following Eurostat (lfsa_etpgan) definitions). In recent years, however, permanent jobs have made a comeback while the number of flexible jobs hardly changed and the incidence of flexible jobs came down from a top of 37% in 2017. Following CBS, flexible jobs comprise any job with a temporary contract, including temporary agency work and on-call contracts; they also include the probationary periods of jobs that are meant to become permanent, and notably also jobs that are legally permanent but have undefined, flexible hours (a small number). The proportion of flexible jobs that count fewer than 12 hours per week has remained steady since the turn of the century, at about one-third. Conversely, compared with 50% in 2003 the incidence of flexible contracts among small jobs became a stunning 73% in 2016, and even 84% including a 10 percentage points upwards leap due to the LFS revision, and subsequently they end at 83% in 2024. Among larger jobs (more than 12 hours worked), the incidence grew from 12% to 20% in 2016 and with, again, a 10 percentage points leap to around 30% in 2016 and 2024. Interestingly, flexible jobs showed a decline in 2020, the year of Coved, while permanent jobs kept growing.
Among flexible jobs, there was a shift toward the most flexible (on-call) contracts, from 24% of all flexible jobs in 2003 to 29% in 2016. LFS revision had a major (+17 points) effect raising the share of on-call to 46% in 2016 but then it declined to 36% in 2024. The most traditional type of flexible contract, temporary agency work, characterized the early stages of growing flexibility in the 1990s and was the prime subject of regulation under the “flexicurity deal”, which was concluded by the social partners in 1996 and later enacted literally by the government in 1999. Temp agency work has remained a steady minority between 16% to 17% of all flexible jobs also in 2017 after which it fell to 13% in 2024. Both on-call and temp agency work never recovered from the fall in 2020 but temporary contracts of less than 1 year expanded their share among flexible jobs from 8% to 15%. The incidence of flexible contracts shows particularly large differences by age (young people are very likely to hold small jobs). However, there are surprisingly small differences across educational levels and gender. Note that while a high proportion of women work part-time, many have permanent contracts.
The number of self-employed workers without personnel (i.e. single self-employed or own-account workers) has also expanded rapidly. In 2016, close to one million workers or 11% of all workers operated primarily in this way, up from 634,000 or 8% in 2003. The number swelled to 1.26 million or 13% in 2024 – a share far above the Eurozone average of 8.8%. In covid year 2020 the self-employed head count remained unchanged (+0.5%) while employee numbers shrank by -0.7%. However, self-employed hours worked fell considerably more (-6.5%) compared with employees (-3.6%).
In comparable positions these self-employed can compete with employees at reduced prices as they enjoy preferential tax treatment and are not covered by mandatory social welfare arrangements (company or industry pension plans, disability, sickness leave, and unemployment insurance) and also do not pay the corresponding social contributions. Obviously, this lends them a relatively high net income, but in a short-sighted exchange for no welfare entitlements in case of problems. It is important to note, however, that a considerable share of self-employed individuals receive also a wage income: around 30% up to 2016 but then increasing to 34% in 2023. The average annual income from labor for the self-employed is at best half as large as for an employee.
This has made hiring (so-called) self-employed attractive for firms, naturally together with the ease of ending the contract. As of 2025 their hiring instead of an employee will be scrutinized more strongly by the tax authorities, on the assumption that they are employees unless convincingly disproven by the employer. Flexible contracts are obviously attractive for employers. But many individuals are also drawn to these contracts for the greater individual freedom and the higher income in the short run, as they don’t have to contribute to social insurance and pension plans and are taxed less. But there is also clear evidence of employer pressure to push workers into these cheaper contracts.
The gross labor force participation rate has essentially remained constant for men, but increased for women from 58% in 2001 to 72% in 2024 (including a 2.5 percentage points leap in 2016 due to the LFS revision). The largest increase has been among women with primary education, whose participation rate rose by twelve percentage points, from 40% to 52% (including a leap of 3.1 percentage points, but their absolute numbers fell equally considerably as the least-educated population shrank by one third. The gender gap in participation rates is largest for those with primary education, at some 17 percentage points in 2024 (52% versus 69%); for those with intermediate education, the male-female gap is 8 points, and for the higher educated it is a mere 3 points. It implies that the collection of women actually employed is better educated than that of men.
The female employment rate increased from 54% in 2001 to 69% in 2024 (with a 1.6 percentage points leap in 2016), while for men it first fell from 74% to 72% in 2016 in spite of a 1 percentage points leap) and then increased to 77% in 2024. Women’s share among the entire labor force increased from 41% to 47% after 2013, their share among employees rose to 50%. Though the prevalence of part-time work grew more rapidly for men than for women (2.96% versus 1.78% annually), it is vastly more important among women as it accounts for 75% of all employed females in 2024 and for men for only 29%. The importance of working part-time declines with educational attainment, starting at 82% for low-educated women, lowering first to 77% for the intermediate educated, and then dropping to 58% among the higher educated. However, it is the latter group that stands out in international comparison. High-educated women in the Netherlands work part-time 2.1 times more often than the corresponding eurozone average, as opposed to lower- and intermediate-educated women, who work part-time 1.7 and 1.8 times respectively as often compared to their eurozone counterparts (following Eurostat’s self-declared definition of part-time).
The age composition of the labor force has changed dramatically in the Netherlands since the turn of the century. The share of older workers (55−74) among the employed increased from 9% in 2001 via 19% in 2016 to 23% in 2024. The share of the prime aged (25−54) decreased from 75% to 60%. Older workers have also shown a notable increase in labor force participation. While their population grew by 57% their employment rate doubled from 25% via 40% in 2016 to 50% in 2024, spread over all levels of education. This terminated much of their non-participation due to disability, early retirement or housework. Note that the youth population 15 to 24 also grew, by 16%, and kept its employment rate unchanged (on balance), and thus maintained its share of total employment. The share of the young remained constant as their employment participation rate while still in school increased. The share of middle-age workers shrank but their employment rates increased significantly.
The aging of the labor force led to discussions about the pension system and the retirement age. The institutionally determined retirement age has been increased, from 65 to 67 and is now related to expected longevity (increasing by 2/3 of the increase in expected duration of life after age 65). The basic state pension (AOW) is now increasingly financed by taxes paid by all (including retirees themselves) and less by social contributions, paid over lower incomes only. The system of additional employee pensions is ‘owned’ by the social partners and depends on premiums paid by employees and employers. It is under reconstruction from defined benefit to (partly collectively) defined contributions (CDC). Pension premiums paid are tax exempt, up to a recently introduced upper threshold, but the later incomes are not (but 65+ are taxed less). The overhaul cannot be explained from budget problems with an aging population, as the system is capital funded and the pension funds have massive reserves. Currently, their total wealth amounts to about € 1,800 to 1,900 bln, (twice GDP) and equals almost 250 times the annual gap of € 7 bln between current pensions paid (€ 57 bln) minus premiums (€ 50 bln). The gradual increase of the mandatory age of retirement puts quite a strain on workers in some occupations. Unions press for special provisions on earlier retirement in occupations with physically demanding work.
The level of education of the working-age population (15−74) has continued increasing since 2001, as the share of lower-educated individuals fell substantially, from 40% to 26% while that of higher-educated individuals doubled from 18% to 37%, leaving a small decline for the middle, 41% to 37%. This development was stronger for women than for men. Between 2001 and 2024, the share of lower-educated men fell by 10 percentage points, while that of the higher educated increased by 15 points; for women, the primary decline was 18 points and the tertiary increase 22 points, respectively. Thus, women have caught up rapidly with men in terms of education, with an inverse gender gap in the share of higher-educated individuals of 2.6 percentage points to the advantage of women, a 7 points change from 2001. This translates into a very similar employment rate (84% to 81%) for high-educated men and women since 2016 but still leaves a clear gap for the low educated (65% to 49%). For many years, women actually employed have on average been better educated, level-wise, than employed men (Salverda, 2015). Presently, there are 3.3% more women employed with a tertiary education than men.
The Netherlands has been a country with positive inflows of immigration since the late 1970s, after three-quarters of a century with net migration hovering around zero.[iii] The share of the population with a foreign background continues to increase. In 2003, 9% of the employed labor force (aged 15−74) had a so-called ‘immigrant background’ from a Western origin country (mostly OECD countries) and 8% from a non-Western origin country, such as Turkey, Morocco, Netherlands Antilles, and Surinam. In 2016, these shares had increased to 10% and 11% respectively. This ‘immigrant background’ includes those born in the Netherlands as second or third generation from foreign-born immigrants. Currently, 26% have this background (table 1, columns 2 and 3): 10% born in the country and 16% actual immigrants over the years. Those from Western backgrounds are more often tertiary educated (46%, 49%) compared to Dutch-born (37%) but nonetheless show lower employment rates. By contrast, fewer non-western Netherlands-born are tertiary educated but they attain a higher employment rate (88%); non-western foreign-born concentrate on primary education (30%) but face a lower employment rate (43%) at the same time. Among Western immigrant men, employment participation rates are only slightly below those of native men, but for non-Western immigrant men, the gap is much larger but declines from 12 percentage points to less than 8 points. Among women, the situation is comparable: a few points lower for Western immigrant women but a rather steady 11 points lower for non-Western ones. For both genders employment rates grew, but more substantially for women.
The Dutch practice of combining first- and second-generation immigrants, which means born from at least one foreign-born parent, was adjusted recently, because it treated people born and educated in the Netherlands differently depending on the migration of their parent(s). Since 2021 detailed statistics distinguish persons born in the Netherlands or foreign-born, both with specification of the own or parental country of origin. This allows us to roughly reconstruct the previous set-up for the sake of consistency but also adds important new insights into those born inside or outside the country (see table 1). Compared to 2016 the two population shares have clearly grown, to 12% in 2023 for a western background and 16% for the non-western ones.
| Table 1. Population (15-74). educational attainment and employment by birth and geographical origin, 2023 | |||||||||||
| Total | Born in the Netherlands | Foreign-born | |||||||||
| 1 | 2 | 3 | 4 | 5 | 6 | 7 | 8 | 9 | 10 | ||
| Western | Non-western | Total | Dutch | Western | Non-western | Total | Western | Non-western | |||
| Population shares | |||||||||||
| All | 100% | 12% | 16% | 82% | 71% | 5% | 5% | 18% | 8% | 11% | |
| Educational shares per category of population | |||||||||||
| All | 100% | 100% | 100% | 100% | 100% | 100% | 100% | 100% | 100% | 100% | |
| Primary | 25% | 23% | 38% | 24% | 23% | 22% | 31% | 33% | 23% | 41% | |
| Secondary | 42% | 34% | 37% | 44% | 44% | 40% | 47% | 32% | 31% | 32% | |
| Tertiary | 33% | 40% | 27% | 32% | 33% | 34% | 25% | 35% | 44% | 28% | |
| Employment rates | |||||||||||
| All | 71% | 68% | 63% | 74% | 74% | 70% | 73% | 62% | 67% | 58% | |
| Primary | 53% | 56% | 47% | 54% | 55% | 51% | 55% | 48% | 58% | 43% | |
| Secondary | 75% | 68% | 70% | 77% | 77% | 73% | 77% | 64% | 64% | 64% | |
| Tertiary | 82% | 77% | 78% | 84% | 84% | 80% | 88% | 74% | 75% | 73% | |
|
Note: Educational shares for western and non-western do not add up precisely to 100% as the educational breakdown is not known for various countries. For Oceania we considered only Australia and New Zealand.
Source: CBS/Statline, Arbeidsdeelname, herkomstlanden gedetailleerd.26/2/2025. Importantly, CBS obtains these data from a register which deviates especially with respect to secondary and tertiary levels from the data mentioned in the text above which are derived from the LFS. |
|||||||||||
Above, we have seen rapid population, labor force and employment growth since 2016. This largely rests on increased net immigration of foreign-born persons born (excluding those of Dutch nationality). This amounts to 675,000 in total over the 16 years from 2001 to 2016 but it amounted to 950,000 or virtually total population growth over the following eight years to 2024. Working-age immigration since 2016 (770,000) exceeded working-age population growth (619,000) by 24%. Their precise position in employment is unknown – as they can also remigrate – but the number of employed persons who are born outside the Netherlands gives an indication. It grows by 540,000 between 2016 and 2024, comprising 44% of total employment growth. Table 1 underlines the significant contribution of the immigrants (18%) that currently far exceeds that of those born from migrant parents in the country itself (10%), but they may include also still employed parents of the Netherlands born.
Western immigrants have substantially higher levels of education than native Dutch people because of different age distributions at immigration, and the gap has been increasing. In 2003, 27% of Western immigrants had the lowest level of recorded education (elementary and lower vocational), compared with 39% of native Dutch people. Meanwhile, 10% of Western immigrants had a university education, against 7% of native Dutch. In 2016, the comparison was 27% versus 32% for the lowest education level and 15% versus 10% for a university education. Non-Western immigrants have a lower education level than native Dutch; however, among these immigrants, the share with the lowest education level has decreased dramatically, from 54% to 39%. Still in 2023, those from western backgrounds are the best educated with a 40% tertiary share, well above the Dutch at 33%, and a 23% primary share, that is comparable to the Dutch. The non-western immigrants have a 38% primary share, virtually unchanged to 2016. The distinction by place of birth that has become available recently, gives those born in the country a 10 percentage points lower primary level and a 15 percentage points higher secondary level. In all respects they also attain virtually the same employment rates compared to all persons born in the country and significantly higher rates compared to all foreign-born.
The unemployment rate among Western immigrants used to be about 1.5 times that of natives, with mild fluctuations over time. Among non-Western immigrants, the ratio was about 2.8, with somewhat larger fluctuations. Trends, in either direction, were not visible. Among people active in the labor market, Western immigrants compared well, with incomes close to or above those of native Dutch people. By contrast, non-Western immigrants fared much worse.[iv] Second-generation Non-Western immigrants had a markedly better relative position in 2001 than in 2014, with an average personal income at 63% rather than 51% of the native Dutch average, and an average income at 77% rather than 51% when standardized for size and composition of the household. The reason for this decline is not clear; it may be due to a composition effect by origin country (e.g. an increase in the share of refugees) and also by age (the non-Western labor force comprising more youth, who generally suffered a stronger earnings decline). Currently, in 2024, the unemployment rate for all foreign-born amounts to 5.8% as against 3.3% for all born in the country. Among the latter the Dutch face 2.9% unemployment and those with immigrant parents 5.3% – both are at half the level of 2016. The two immigrant groups taken together irrespective of their place of birth have a 5.6% unemployment rate. Thus, non-Dutch unemployment rates are almost two times higher and have not necessarily come closer relatively than before.
The Netherlands Working Conditions Survey (NEA) asks respondents how their knowledge and skills fit the demands of their jobs. They are considered overqualified if the former exceeds the latter and vice-versa. Almost a third deem themselves overqualified and another 6% to 7% underqualified. Overqualification is above average for young workers, and in the branches of trade, transport, hotels & catering and recreation. Outcomes are virtually the same for 2016 and 2024. Unfortunately, the comparison is not detailed by job level or educational attainment but earlier research points to above-average overqualification in elementary jobs and also for the highest educated (Salverda, 2015). Eurostat (lfsa_eoqgan) measures over-qualification as the percentage or the tertiary educated (ISCED 5-8) who are employed in lower-level jobs (ISCO 4-9). It has been hovering between 14% and 16.5% for the last two decades. If, in addition, we deem the secondary educated (ISCED 3-4) to be overeducated when employed in ISCO 9 jobs (lfsa_egised), 50% of all elementary job occupants appear to be overeducated, against 30% in 2001 and 48% in 2016.
The nature of tasks to be performed and, hence, the requirements put on workers, have changed substantially over the last 20 years. A recent study employs indices for the intensity of the routine character in the tasks to be performed in an occupation and distinguishes five types: routine manual, non-routine manual, routine cognitive, non-routine analytic, and non-routine interactive (the study estimates the share of each category in the total workload) (Fouarge et al., 2017). Between 1996 and 2015, relative to occupations with a high share of non-routine analytic tasks, employment growth is significantly lower in occupations with high shares of the other four task categories, especially for those that are primarily routine manual. Likewise, between 1999 and 2012, wage growth by occupation is significantly lower in those four categories when compared with non-routine analytic occupations, by some 7% to 15%. The high relative growth for jobs with non-routine analytic tasks points to an increase in job quality that can match the increase in the level of education of the labor force; lagging wage growth in the other categories, mostly covering less challenging jobs, points to deterioration in attractivity of such jobs.
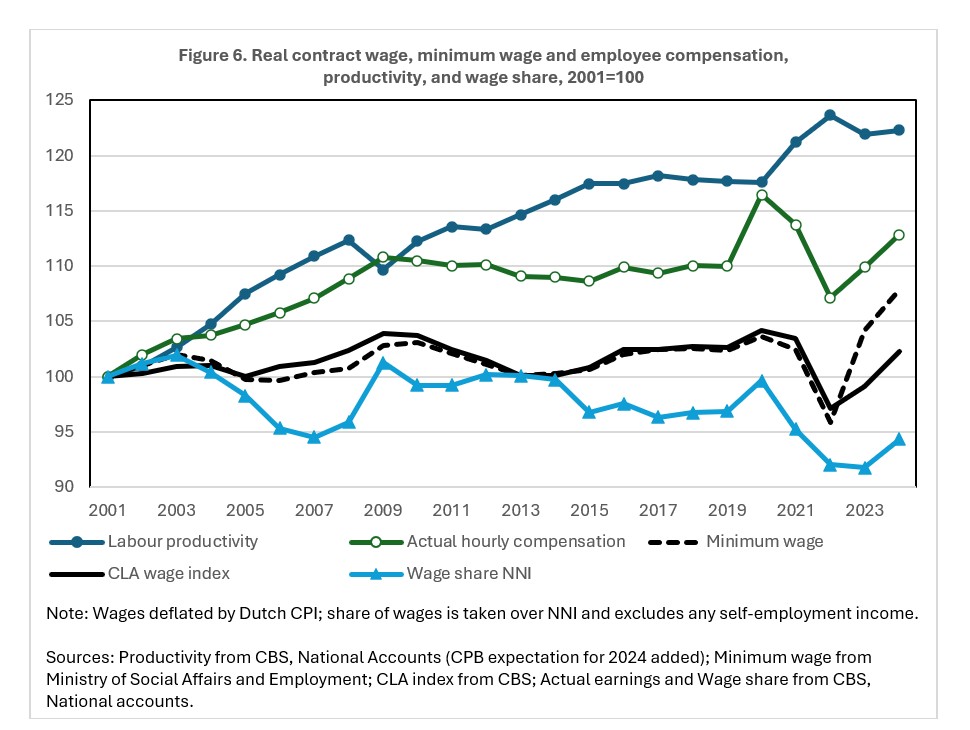
Collective labor agreements (CLAs), which are agreed between trade unions and employers, are at the very core of regulating the Dutch labor market, covering more than 70% of employees. Among other things, CLAs stipulate occupation-related seniority wage scales (so-called “contract wages”) and are mostly bargained at the industry level. Regular wage bargaining covers the general adjustment of nominal wage levels to account for the evolution of prices and productivity; the bargaining process depends on economic projections of the Dutch Central Planning Bureau (CPB), the government’s main economic advisory body (Salverda, 2008). For many workers, this is the only source of pay increase (Teulings and Hartog, 1998). The evolution of contract wages per hour of work thus reflects the general pay increases established between unions and employers. These increases are directly observed by the CBS and presented by means of a joint index number for all covered wages.[v] The index is a core statistic in the Netherlands, which controls the bi-annual adjustment of both the statutory minimum wage and social benefits (and therewith government spending). The statistic very strikingly (if not implausibly) shows, on balance, no increase in real contract wages (Dutch CPI deflated), over the half century since the early 1970s, leaving trade unions empty-handed over long years of wage negotiations (Salverda, 2023).[vi]
Figure 6 pictures the utter stagnation of the CLA wage index after deflation for the present quarter century. Levels of 4% higher than in 2001 were reached twice, in 2009 and 2019, but followed by declines to 0% and even minus 3% respectively, ending in 2024 at a mere +2%. Overall, unions appear to have little clout in the negotiations though they have managed to repair in 2023 and 2024 the damage done by the exceptionally high inflation in 2022.
The real statutory minimum wage follows largely the same trajectory as contracted wages (see figure 1), shadowed at an increasing distance by the real net minimum income for a couple, but not fully as it was not indexed but lowered or frozen by the government on several occasions. The notable exception is the year 2023 when the minimum wage was specially and additionally increased by 8.05% to remedy its enormous fall due to the 10% price increase of 2022. This was followed in 2024 by the traditional uprating in parallel to the CLA index and lifted the level 8% higher than at the start in 2001.
No index number exists of wages actually earned by employees who are covered by CLAs that could help to identify the effects of contract wages on wage formation (Salverda, 2008 and 2023). Effectively, for actual earnings only the National Accounts data on the average “compensation of employees” exist. This concept is comprehensive, including employer contributions to social insurance and occupational pensions, and as fully a running average it incorporates all pay changes of both CLA and non-CLA employees and shifts in the employment structure. Though the time patterns of the two series in Figure 6 are rather similar, it is systematically unknown to what extent labor contracts have effectively showed continued wage moderation and lagged actual average earnings. Incidental data (2006-2019) indicate a cumulative increase in the contract index number by 1.6% while the running average of actual CLA earnings increased almost twice as fast by 3.0% and non-CLA earnings again almost twice faster by 5.8% (Salverda, 2024). This points to a clear process of labor market change which would make it inappropriate to simply incorporate it in the concept of wage drift.
As Figure 6 shows, real hourly compensation of employees rose by 11% from 2001 to 2009, and largely stayed there until 2019. The steep rise in 2020, the first year of the pandemic, is a statistical curiosity as compared to 2019 hours worked declined (-3.6%) while persons mostly retained their jobs and pay (Figure 3) so hours actually paid remained unchanged (-0.1%). This was the result of immediate and generous government assistance (CBS, 2022; CPB, 2021). The national sum of wages rose by € 31 bln over 2020 and 2021 combined while direct wage subsidies (the so-called NOW measure) amounted to € 24 bln.[vii] The subsequent fall in 2022 of both real contract wages and actual earnings reflects the sudden rise of prices by 10% provoked by the Russian war against Ukraine. Ultimately, actual earnings rose by 13% from 2001 to 2024, six times the 2% rise of contract wages.
Contract wages lag far behind productivity growth. Actual wages follow more closely, but still have fallen some 10% behind in 2024. Hourly labor productivity had grown by 18% in 2020 and then quickly jumped to 24% in 2022 followed by a slight decline in 2023. This rise exceeds the growth in contractual wages twelvefold and in actual earnings almost twofold.[viii] As consumer prices rose somewhat faster than producer prices, workers lost somewhat less from the point of view of employers. Still, the pure wage share (wages in national income) shows a drop of some 5 percentage points from 2001 to 2024. It never really exceeded its 2001 level (67%) and had fallen to 61% in 2023, well below 64% at the time of the Financial Crisis, before it recovered somewhat to 63% in 2024. The zero-difference between productivity and the actual wage for the year 2020, as in 2001, apparently does not correct for the generous government support mentioned above. The Dutch adjusted labor share (AIQ) is another key institutional statistic, which at a certain threshold legally allows the government to prevent the regular uprating of minimum wage and benefits. The AIQ is calculated for the private sector and tops wages up idiosyncratically with total self-employed earnings by way of an attributed income from labor. It has followed almost the same pattern as the pure wage share albeit at a higher level, declining from 74% in 2001 via 68% in 2007 and 72% in 2016 to 68% in 2022-2024, except that it keeps the current level equal to the Financial Crisis – which likely mirrors the significant growth of self-employment.
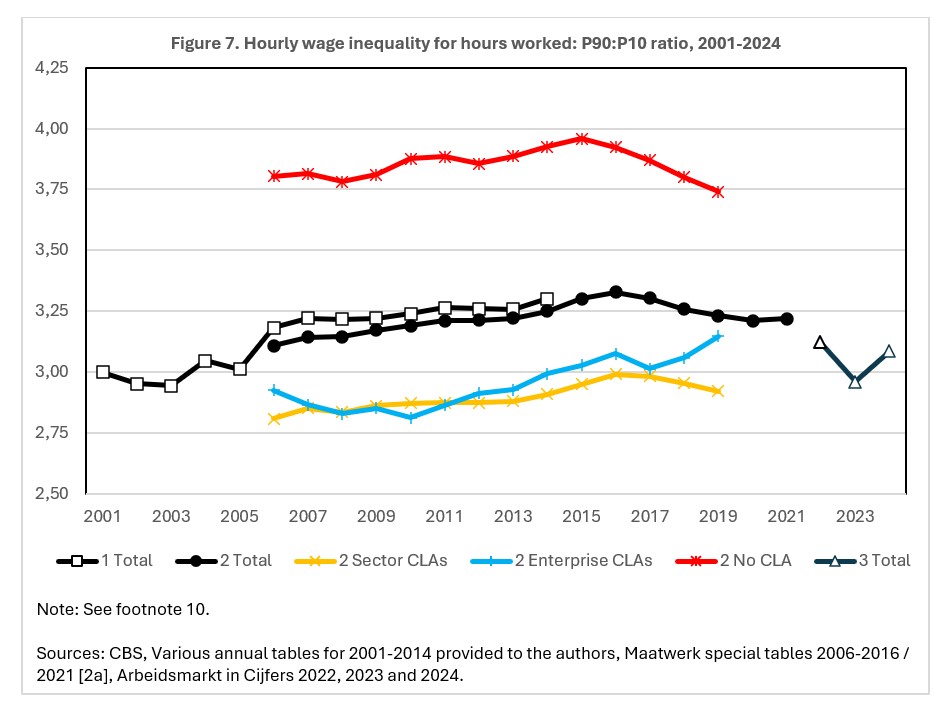
Figure 7 presents the evolution of wage inequality as measured by the decile ratio P90:P10, the ratio between wages at the 90th and the 10th percentile respectively. The data concern hourly wages over all employee hours worked during the year. Annual wages would show much larger inequality as they rest also on unequal working hours and include annual bonuses which are skewed to higher levels of hourly pay.[ix] From the wage distributions we have estimated decile thresholds with linear interpolation in the marginal cells. We use three data sets from CBS (the national statistical agency), covering different time intervals that partly overlap.[x] Series 1 and 2 have a long overlap and tell the same story: the decile ratio jumps up after 2005, partly because of improved observation, and shows a slower increase until 2016 and subsequently declines slightly. The maximum increase in inequality is 10% which falls back to an increase between 0% and 3%. It seems to suggest that the record-low share of wages in GDP does not go together with record-high wage inequality. The upper-half (P90:P50) and lower-half (P50:P10) inequality ratios show the same rise to 2016. However, P50:P10 bears responsibility for the volatility of the 2000s while P90:P50 declines robustly after 2021.
Shares of low-wage (LWE) and high-wage (HWE) employment derived from these data show a comparable pattern. They are commonly defined as hourly pay below two-thirds of the median wage or above 1.5 times the median respectively. Both increase until 2016 followed by decline after that for LWE, particularly after 2021, while HWE remains stable until a (smaller) decline after 2021. In 2024 17% of all hours are low paid and 18% high paid, with the remaining 65% in the middle. Similarly, the employment share of hours worked paid up to the adult minimum wage can be estimated. Note that many are paid below this wage, according to a long tail of youth minimum wages (and all wages paid in between) that start from a level of 30% at age 15. The incidence shows some increase up to 2017 and then a decline, which is partly due to the shortening of the youth tail as the adult minimum-wage age was reduced from 23 years of age to 21 years, over the course of the years 2017 to 2019. This may have contributed to the decline of low-wage employment in those years. A decline also shows for the year 2024, when the legal definition of the minimum wage was changed to an hourly basis based on a uniform 36 weekly hours across the economy. That lifted anyone above the minimum wage who was working longer hours than 36.
Note, finally, that the expansion of part-time employment will have increased wage inequality as hourly pay in part-time jobs is substantially less than in full-time jobs. Hourly pay as a percentage of full-time pay varies between 57% for 12 weekly hours to 91% for 30 to 35 hours. Thus, the shift towards larger part-time jobs may at the same time have reduced inequality – between 2016 and 2024 the average percentage of full-time pay for all part-time employed regardless of hours worked increased from 80% to 83%.
Importantly, with a breakdown by sector and enterprise CLA’s and no-CLA Series 2 provides additional insights for the intermediate period 2006 to 2019 into the effects that CLAs may have on the inequality of hourly wages actually paid. This also reflects composition changes in the economy and between CLAs. Wage inequality appears to be far higher than average if no CLA applies, based on a polarized wage distribution from low and high pay. Inequality is below average if covered by CLAs, based on a denser distribution with less high pay. However, over the years inequality appears to rise also when CLAs apply; apparently, they offer some protection against inequality in cross-section but not over time.
Over the period 2006-2019, CLA coverage declined from 75.5% to 71.0% of total hours worked and from 72.5% to 67.0% of the sum-total wages. Non-coverage increased from 24.5% to 29.0% of hours and 27.6% to 33.0% of wages, thus increasing overall inequality. Importantly, the CLA decline is almost entirely due to the shrinking coverage of enterprise CLAs (12.5% to 8.3%) while the much more important sector agreements hardly shrank (63.1% to 62.7%).[xi] Though the share of high wages among CLA’s did not change, their grip on total HWE declined as the share among non-CLA grew substantially. The level of CLA coverage is high but it falls short of the 80% level which is the aim of the European Directive on adequate minimum wages of October 2022. Nonetheless, the coverage is high in spite of a much lower union density, which fell from 22% in 2001 to 17% in 2016 and an estimated 14% in 2024 – for the economy as a whole including the public sector.
The corollary of this low density, however, is twofold. First, sectoral agreements need to be declared generally binding by the Minister of Social Affairs and Employment for all enterprise in the industry including non-members of the negotiating partners. This can be done only if those partners represent at least 55% to 60% of all employees in the industry. Given low union density it is often the employer association who can provide this. It may give them a certain edge in the negotiations which can be interpreted as a kind of collective monopsony that has contributed to long years of wage moderation. It may help to understand that each time CLAs came under fire from the government employers joined unions in their defense. Second, there is little or no union presence at the work floor that can check employer behavior against CLAs or other agreements. This may particularly have created havoc on flexible contracts that have been and are concluded massively by individual firms with individual employees despite the social partners’ national flexicurity agreement of 1996 that aimed to prevent this but paradoxically opened the legal option for individual firms (Salverda, 2020).
In most recent years the Dutch economy and labor market have very quickly revived after the pandemic. They are now firing on very important cylinders: the highest international trade surplus ever, about the lowest government debt in 45 years, the highest employment rate and population size ever – based almost entirely on net immigration since 2016 – accompanied by shifts from flexible to permanent contracts, growth of full-time jobs, and a remarkably high vacancy rate, but at the same time also the lowest wage share as well as relatively low wage inequality and a modest low-wage employment share. And, in addition, surprisingly stagnating GDP and productivity growth in 2023 and 2024.
In the post-war period, until the 1980’s, the Netherlands had a corporatist structure: a highly institutionalized system where labor unions, employer associations and the government have intense interaction and bargaining on the terms of labor contracts and complementary labor market and social policies (see Teulings and Hartog, 1998). Labor relations were essentially co-operative rather than confrontational, wage developments were moderate, in step with productivity growth, wage inequalities were deliberately kept modest. The government took responsibility for welfare state provisions to protect the worker against all kinds of negative shocks; social partners had a strong say in administering unemployment, disability and sickness insurance which were financed from wages.
The neoliberal ideology that came up in the 1980’s, with a strong belief in markets rather than government regulation, inspired dramatic institutional changes, of which the full effects have become clearly visible in the first quarter of the present century. Two main changes stand out: the power balance among employers and workers shifted drastically toward employers and labor lost the backing of the central government: the embedding of the labor market in social security was drastically reformed and the statutory minimum wage was lowered and frozen on several occasions. This has gone hand in hand with a growing fracturing of the labor force along dimensions of immigration, wages, educational attainment and the allocation of employment over households and their members. This has complicated policy making and contributed to the shifting of power away from unions to employers.
The shift in bargaining power towards employers is visible in several results. First, wages were kept low, they lagged behind productivity growth and the share of labor income in national income declined. This is not a straight and simple consequence of increased international competition in product markets. Profits were not squeezed out but increased: between 2019 and 2023, wages increased by 24% and profits by 32%.[xii] Profits as a share of value added, for non-financial companies, increased from 39.3 percent in 2001 via 39.8% in 2016 to 41,3 percent in 2023. More generally, the (relative) operating surplus grew ever higher after 2014. The index of the Amsterdam stock exchange, base 100 in 1988, stood at 689 in 2022 and at 892 in August 2025.
Second, employers shifted much of the risk of output volatility and slack hours in production and sales to workers, with a dramatic increase in flexible labor contracts: temporary contracts, probation periods, part-time jobs, variable hours contracts. The increase in flexibility certainly matches to some extent the increased demand for flexibility from a section of the labor force that did not opt for a regular full-time job but wanted more individual freedom. But equally clear, flexibility has been imposed also on workers who would prefer a secure regular job.
Third, employers got their way with massive immigration.[xiii] Employers never had difficulties to hire high skilled foreigners and importing workers above a threshold wage was essentially unconstrained. Low skilled and even illegal (“undocumented”) workers facilitated the survival of low-wage industries like meatpacking, horticulture and other segments of agriculture, cleaning, hotel and restaurant services, delivery services, construction. Immigrants, students and increasingly participating women gave employers access to an alternative labor supply.
Fourth, employers secured a radical overhaul of the worker pension system, from defined benefit to defined contribution. With defined benefit, the premium, shared by employers and employees, had to be set in annual negotiations. Employers prefer a fixed rate. And they were not happy about the high premiums that followed from the very conservative solvency requirements enforced by the Central Bank. The overhaul of the pension system was not at the initiative of the unions, who also represent retirees. They only accepted the change when the government agreed to a slowdown in the rate of future increases of the age of mandatory retirement.
The power shift could also occur because union strength diminished. Union membership declined from some 35 to 40 % in the 1980’s to 16% in 2022, according to CBS data. Unions cover both workers and retirees. In 2018, 18 percent of employees between ages 15 and 75 were a member, in 2023 this has declined to 15 percent. Increasing heterogeneity of the labor force, increased individualism and reduced labor force attachments no doubt play a role to explain the decline. Coverage of collective agreements was also declining, from 75.8 percent of head-count employees in 2010 to 71.8 percent in 2022.
The neoliberal ideology also strongly influenced government policies. Woltring (2024) analyses “the “radical transformation of the Dutch welfare state” between the 1980’s and the early 2000’s. She sums up the changes and relates them to virtual unanimity of politicians, top-level civil servants and academics on the need for this fundamental reorientation. Disability compensation and unemployment payments were lowered. Social partners lost their prime authority over these employee insurances and were constrained to advisers rather than rulers. Government policies shifted to emphasis on market mechanisms and financial incentives, privatization, cutbacks on social security expenditures and the real and relative lowering of the statutory minimum wage were much larger than in comparable countries, liberalization of the labor market was more fundamental than in neighboring countries.
The political debate in the country gets increasingly serious on the question whether these developments have gone too far. Substantial increases in the minimum wage are contemplated as is curbing low-wage employment and corresponding immigration, and so are better regulatory checks on bogus self-employment (including in the platform economy) regarding the employment contract, income taxation and (obligatory) disability insurance. A sense of urgency is growing to actually implement necessary remedial policies.
The heterogeneity of labor demand in the Netherlands has increased along several dimensions. Job qualifications have become more specific as jobs have become more idiosyncratic. Labor demand has become less stable as product-market uncertainty and volatility have increased, and employers increasingly manage to pass risks on to workers. With this in mind, not all dimensions of risk allocation, such as job and employment instability and earnings variability, have been documented in this paper, and some are not even found in standard statistical records.
It should be observed that the dynamics of household formation complicate the assessment of wage inequality for the inequality of welfare (Salverda and Checchi, 2015; Salverda and Rook, 2022) and also for the understanding of how supply and demand in the labor market work out. Most working-age households receive more than one income from labor. Viewed from individual labor supply some three quarters of all employees share their household with another employee, while the remaining quarter is spread over single-earner households. Dual-earner households take most of the responsibility for the rapid increase in wage earnings within the top 10% share of incomes (Salverda and Atkinson, 2007; Salverda, 2019). But the relationship works both ways. These households often combine higher paid full-time jobs with lower paid part-time ones. The latter lends them an important presence at the same time at the lower end of the wage distribution, where they may compete, given their household circumstances, on more favorable, lower wages than relevant workers from single-earner households (Salverda and Rook, 2022 and 2023). Viewed from household labor supply, however, close to 40% of all households are still single-earner. They lost their dominance in the labor market but still are a force to reckon with in wage formation and certainly in social policy making. Note that at the household level the distinction between employees and self-employed is also blurred, even more than the one-third overlap at the personal level already mentioned: half of all households that primarily depend on self-employed incomes receive also a wage income. This may help to compensate up to a point the lack of social insurance or a lower level of pay. Thus, the relationship between individual labor supply and the formation and composition of households has become increasingly complex. High-income household members facilitate partners to forgo earnings in favor of other job characteristics, e.g. permanent contracts; this may be reinforced by the income-tax system which grants the same fiscal advantage for an annual minimum-wage-level income to the year-long full-time earner of the minimum wage as to the part-time earner who works half time for double the hourly minimum wage .
Preferences for household work and childcare increase the supply of flexible (and nearby) part-time work; and students combine school and work by taking small, often flexible jobs. These factors increase the importance of the household setting for individual labor supply, make individual earnings less dominant for the distribution of individual welfare and, conversely, make individual economic potential a more important determinant of household formation and break-up. Thus, conditioning economic outcomes on the increasingly complex household situation becomes more important, while, at the same time, the reverse relationship should not be ignored.
It is easy to summarize the macro developments in the Netherlands over the past 25 years. There were some cyclical swings in employment and unemployment; a strong recession in 2008−2009 that extended to 2014 because of the Eurocrisis; a stagnant average wage for intensifying work; an actual average wage lagging behind productivity growth; and a diminished labor share in national income, continuing a longer-term trend. The wage developments have continued in spite of the impressively fast recovery of the economy and employment over te last ten years.
Much of the formal institutional framework has been stable for decades, but the balance of power has shifted dramatically over time. Ultimately, social dialogue and collective bargaining are as weak as the weakest partner. The formal structure is particularly important for unions, as they have comparatively little presence in the workplace and face declining density; their organizational coverage is now far below that of employer associations. The model has become known for its tradition of wage moderation and its annual political preoccupation with the effect on inequality of next year’s government budget proposals. Since the liberalization of international capital movements, employers have increased their power vis-à-vis the other two partners in this social dialogue. Since the formation of the EU monetary union, the government has also faced increasing constraints on policy making. At the same time, the growth to dominance of dual earners in the labor market while single earners still retain an important presence among households adds critical complexity to labor supply and to social dialogue about policy making, which was not there in the traditional single-earner world. Below the surface of these aggregate developments there is much heterogeneity with many interacting features. Increased uncertainty, volatility, and product-market competition fuel employers’ growing demand for flexible labor contracts. This puts strain on some categories of workers, such as low-wage workers with little opportunity for self-employment, while others enjoy the increased opportunity for autonomy and flexibility. Labor supply has become more fragmented in terms of contract types, hours worked, and its distribution within households. Both men’s and women’s labor market behavior have become more diverse. Students and women with a partner are increasingly seeking part-time, flexible work opportunities for the earnings and job satisfaction that these can provide, in combination with other non-work-related activities, such as care work or education. However, this may augment the labor supply pool, and negatively affect other workers seeking full-time opportunities. More than ever, labor supply is a household decision; but, conversely, the formation of households also responds to the opportunities in the labor market (Salverda and Brals, 2016).
Looking ahead, a major policy challenge is to ensure investment in human capital for the growing share of part-time and flexible workers (including both job-specific and more general skills), for whom employers have fewer incentives to provide training. The social partners control investment funds based on collective labor agreements and fed by wage restraint that are specifically designed for this purpose, but there is no evidence that they are being effectively used to enhance worker skills. Moreover, these funds are organized along industry lines, which is not conducive to provide general, non-industry-specific training that would be necessary to support cross-industry job mobility. To combat this challenge, policymakers should consider establishing an institution that stimulates and helps in the financing of training for individuals beyond the age of initial education.
We also advise a broader reflection on education and to aim for supply of labor market entrants with educations that contribute to productivity growth, to combat shortage of craftsmen (and craftswomen) and to discourage demand for immigrants by generating more domestic supply in excess demand sectors.
The system of income taxation needs to be evaluated for its focus on annual incomes while employment is increasingly differentiated on the basis of hours of work.
Finally, a significant rise in the statutory minimum wage may also reduce the need for low skilled immigrants to the extent that low-wage-based industry would shrink and domestic labor supply might be forthcoming, and at the same time combat the rise in earnings inequality.
Previous work of the authors contains a larger number of background references for the material presented here and has been used intensively in all major parts of this paper
The authors declare to have observed the IZA Guiding Principles of Research Integrity.
© Wiemer Salverda and Joop Hartog
Beek, Jan van de, Hans Roodenburg, Joop Hartog, Gerrit Kreffer (2023). Borderless Welfare state, Zeist: demo-demo; Download Borderless Welfare State – Demo Demo. For a summary see IZA DP 17569
Centraal Bureau voor de Statistiek (CBS) (2021) “Uurlonen naar percentiel’’ (Hourly wages by percentile). The Hague. Uurlonen, 2006-2019 | CBS
Centraal Bureau voor de Statistiek (CBS) (2022) Twee jaar coronasteun. Een terugblik. (Looking back at two years of Covid support) The Hague. Over deze publicatie – Twee jaar coronasteun | CBS
Centraal Planbureau (CPB), Nederlandsche Bank (DNB), Centraal Bureau voor de Statistiek (CBS) (2017). Herziening methode arbeidsinkomensquote. (Revision of measuring the adjusted labor share AIQ) The Hague
Centraal Planbureau (CPB) (2021), Macro-economische effecten van coronasteunbeleid in 2020. (Macroeconomic effects of Covid support in 2020) The Hague
Fouarge, D., Smits, W., de Vries, J., de Vries, R. (2017). “Ongelijkheid en veranderingen in de beroepenstructuur.” (Inequality and changes in the occupational structure) In: Chkalova, K., van Genabeek, J., Sanders, J., Smits, W. (eds). Dynamiek op de Nederlandse arbeidsmarkt. Focus op ongelijkheid. Den Haag/Heerlen/Bonaire/Leiden: Centraal Bureau voor de Statistiek / TNO. The Hague
Hartog, J. (2024). The political economy of immigration in The Netherlands, Population, land and welfare, London: Routledge
Hartog, J., Salverda, W. (2018). “The labor market in the Netherlands, 2001–2016”. IZA World of Labor 2018: 418 doi: 10.15185/izawol.418
Salverda, W. (2008). “The Bite and Effects of Wage Bargaining in the Netherlands 1995–2005”. In: M. Keune and B. Galgóczi, editors. Wages and Wage Bargaining in Europe; Developments since the mid-1990s, 225–254. ETUI, Brussels.
Salverda, W. (2015). “Merit en werk in 1960–2010: Effecten van de Nederlandse onderwijs- en deeltijdtsunami’s”. (Merit and work 1960–2010: Effects of the Tsunamis of Educational Attainment and Part-time Work in the Netherlands). In: Herman van de Werfhorst, editor. Een kloof van alle tijden. Verschillen tussen lager en hoger opgeleiden in werk, cultuur en politiek. 53–81. Amsterdam University Press
Salverda, W. (2018). “The Netherlands: Is the Polder Model behind the curve with regard to growing household income inequality?”
In: D. Vaughan‐Whitehead, ed. Reducing Inequalities in Europe. How Industrial Relations and Labour Policies Can Close the Gap. 368–423. Edward Elgar.
Salverda, W. (2019).Top Incomes, Income and Wealth Inequality in the Netherlands: The first 100 Years 1914–2014 – what’s next? World Inequality Database WID.World Working paper 2019/02. https://wid.world/document/top-incomes-income-and-wealth-inequality-in-the-netherlands-the-first-100-years-1914-2014-whats-next-wid-world-wp-2-2019/
Salverda, W. (2020). “De Flexwolf verslindt de Nederlandse arbeidsmarkt” (The Wolf of flexibility devours the Dutch labor market) Economisch-Statistische Berichten, 178-181, 9 April De Flexwolf verslindt de Nederlandse arbeidsmarkt – ESB
Salverda, W. (2023). “Welvaartswinst afgelopen halve eeuw voorbij gegaan aan sociale minima”. (The progress of prosperity has passed over social minimum incomes) Economisch-Statistische Berichten, 108 (4825), 28 September. 414-416_Salverda2.pdf (esb.nu)
Salverda, W. (2024).“Terwijl CAO-dekking daalt, nemen loonongelijkheid en bestaansonzekerheid toe”. (With declining coverage of collective agreements wage inequality and existential insecurity increase) Economisch-Statistische Berichten, 109 (4833), 23 May, 222–225. 222-225_Salverda.pdf (esb.nu)
Salverda, W. (2024).“The Netherlands’ Minimum Wage 1969–2022: Can We Learn from Decline?” Jahrbücher für Nationalökonomie und Statistik. 23/8/2024. DOI 10.1515/jbnst-2023-0036 Journal of Economics and Statistics 2025; 245(1–2): 45–78
Salverda, W., Atkinson, A. B. (2007).”Top incomes in the Netherlands over the twentieth century.” In: Atkinson, A. B., Piketty, T. (eds). Top Incomes Over the Twentieth Century: A Contrast between Continental European and English-Speaking Countries. Oxford: Oxford University Press
Salverda, W., and D. Brals (2016). Opleiding, deeltijdarbeid en huishouden : meritocratie op de arbeidsmarkt sinds 1990.(Educational attainment, part-time employment and the household: Meritocracy in the labour market since 1990) In P. de Beer and M. van Pinxteren, ed. Meritocratie. Op weg naar een nieuwe klassensamenleving? 135-164. Amsterdam University Press.
Salverda, W., and D. Checchi (2015). “Labour-market institutions and the dispersion of wage earnings.” In: Atkinson, A. B. and F. Bourguignon (eds). Handbook of Income Distribution. Volume 2B. Amsterdam: Elsevier. See also http://ftp.iza.org/dp8220.pdf
Salverda, W., and V. Rook (2022). “Aantal verdieners in huishouden bepaalt inkomens- én arbeidsmarktpositie” (The number of earners in the households determines income and position in the labor market) Economisch-Statistische Berichten, 370-373, 25 August Aantal verdieners in huishouden bepaalt inkomens- én arbeidsmarktpositie (esb.nu)
Salverda, W., and V. Rook (2023). The vicious entanglement of labour-market and income inequalities in Europe . Centrum voor Sociaal Beleid Herman Deleeck (CSB), University of Antwerp. Working Paper No. 23/02. 656bf05c-5df7-481b-8aaa-259b1038e72c.pdf (uantwerpen.be)
Teulings, C., Hartog, J. (1998). Corporatism or Competition? Cambridge: Cambridge University Press
[i] Earlier, we described labor market developments for the period 2001-2016 (Hartog and Salverda 2018). Rather than considering just rapid changes in the years elapsed since then, we have opted for a view on the extended period to understand the continuity of and change in essential developments.
[ii] Compared to Hartog and Salverda (2016) several significant revisions (laid back to earlier years) of the national accounts (2015, 2021), the labor force survey (EBB) (2013, 2021) – both in line with changing international regulations – and income statistics (2011) have occurred which we mention below when relevant for consistency over time. Evidently, we cannot report on undocumented immigrants, and possibly not on workers in the service of foreign temp agencies.
[iii] For more details on the development of immigration to the Netherlands and an analysis of economic effects, see Hartog (2024). For an extensive analysis of the effect of immigrants on government finances, see Van de Beek et al. (2023).
[iv] This explains why non-Western immigrants make a substantial negative net contribution to the government budget; see Van de Beek et al. (2023).
[v] The index is based on a fixed weighting of individual collective agreements; weights are equal to the sum of wages they cover, with revision roughly every ten years. The actual distribution of individual employees over and within CLA wage scales is not captured nor is the very distribution CLAs themselves.
[vi][vi] The statistic leaves out employer contributions to social insurance and occupational pensions, which are an important part of total labor costs (and mostly taken into account in the negotiations). However, this exclusion may make little difference to the evolution as actual earnings evolve virtually identically whether excluding or including such contributions.
[vii] This made 2020 the only exception (+6%) to the steady decline in government debt from 67% in 2014 to 44% in 2024, the second-lowest level ever since 1980.
[viii] If actual earnings would be deflated by GDP prices (+67%), relevant to producers, instead of the CPI (+75%) the pattern would be somewhat different (lower until 2012, level to 2020 and higher in 2022 and 2023), but still always considerably below the rise of productivity and ultimately end only 1 percentage point higher in 2024.
[ix] The annual P90:P10 ratio roughly estimated from classes of Series #2 type data (see next footnote) equals 10 on average over 2006-2010, with P50:P10 at almost 5.
[x] Series #1 (2001-14) has a traditional sampling frame across enterprise which widens over time (to improve coverage of low wages, esp. in 2006) and is structured by classes of hourly wages and presents the number of jobs spread over six categories of weekly working hours worked that, multiplied by the categories’ midpoints, are used to estimate total hours worked. Series #2 (2006-2021) is based on comprehensive administrative data and presents maximum hourly wages in 99 percentiles (excl. top, but with an overall average) of all hours worked that helps to integrate the 100th percentile. Series #3 (2022-2024) is again based on full administrative reporting but presents rough (tenths of) percentages of total hours worked distributed over classes of hourly wages (capped at 60 euro in 2022 and 2023 and 70 euro in 2024). These data are also preliminary. This may affect the precision of the linear interpolation. Hourly wages are steadily defined as excluding annual bonuses (which include the statutory holiday allowance and equal 16% of total annual wages), whose importance increases with the level of wages and whose inclusion would produce higher levels of wage inequality.
[xi] It cannot be excluded that certain enterprise CLA’s have been incorporated into the sectoral ones, which in that case would have shrunk.
[xii] Winsten stijgen harder dan lonen | CBS
[xiii] For details on immigration and immigration policies, see Hartog (2024).